View all Otterburn Park apartments on a map.
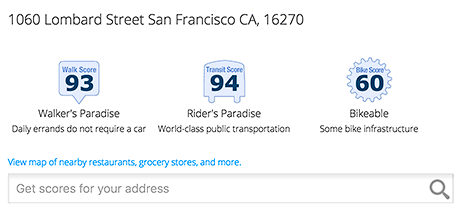
Otterburn Park has an average Walk Score of 15 with 8,450 residents.
Otterburn Park does not have many bike lanes.
Almost all errands require a car.

Otterburn Park has an average Walk Score of 15 with 8,450 residents.
Otterburn Park does not have many bike lanes.
View all Otterburn Park apartments on a map.
There are about 74 restaurants, bars and coffee shops in Otterburn Park.
People in Otterburn Park can walk to an average of 3 restaurants, bars and coffee shops in 5 minutes.
Minimal bike infrastructure.

Add Walk Score, Bike Score, and Transit Score to your rental and for sale properties with the Walk Score Widget.

Build apps with Walk Score, public transit data, and commute and travel times via Walk Score APIs.

Use Walk Score data for real estate, public health, finance, and urban planning research and analysis.