
#1
San Francisco
Walk Score: 88.7
Walk Score is available for any address in the United States and Canada. We've also ranked more than 2,800 cities and over 10,000 neighborhoods so you can find a walkable home or apartment.
We believe that walkable neighborhoods with access to public transit, better commutes, and proximity to the people and places you love are the key to a happier, healthier and more sustainable lifestyle.

San Francisco is famous for beauty, bridges, Victorian architecture, hilly landscape and diverse people. Find San Francisco apartments and San Francisco Real Estate.
Top neighborhoods:


The Big Apple is the financial capital of the US and home to Times Square and the Empire State Building. Find New York apartments and New York Real Estate.
Top neighborhoods:


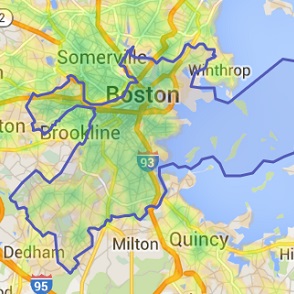
The Athens of America, Boston is a leader in technology and U.S universities including Harvard and MIT. Find Boston apartments and Boston Real Estate.
Top neighborhoods:
Top neighborhoods:


The Nation's capital of the United States, Washington DC is rich in government jobs and places to live. Find Washington, DC apartments and Washington, DC Real Estate.
Top neighborhoods:


Sunny Miami, Florida, one of America's cleanest cities, is a mecca for beaches, nightlife and bicycles. Find Miami apartments and Miami Real Estate.
Top neighborhoods:


East Bay's Oakland is a vibrant city with art, culture and sunshine in the San Francisco Bay area. Find Oakland apartments and Oakland Real Estate.
Top neighborhoods:


A vibrant city with rich history, Philly is a hub of business, art, education, and cheesesteaks. Find Philadelphia apartments and Philadelphia Real Estate.
Top neighborhoods:


The Emerald City of Seattle has rapidly growing walkable neighborhoods surrounded by mountains and water. Find Seattle apartments and Seattle Real Estate.
Top neighborhoods:


Long Beach combines world class urban amenities with small town charm and a laid back lifestyle. Find Long Beach apartments.
Top neighborhoods:

Top neighborhoods:

Top neighborhoods:

Top neighborhoods:

Top neighborhoods:

Top neighborhoods:

Top neighborhoods:

Top neighborhoods:
The 130 cities we rate with a population of 200,000 or greater have an average Walk Score of 48.
City | State | Walk Score | Transit Score | Bike Score | Population |
|---|---|---|---|---|---|
| New York | NY | 88.0 | 88.6 | 69.3 | 8,175,133 |
| Los Angeles | CA | 68.6 | 52.9 | 58.7 | 3,792,621 |
| Houston | TX | 47.5 | 36.2 | 48.6 | 2,099,451 |
| Philadelphia | PA | 74.8 | 67.0 | 66.7 | 1,526,006 |
| Phoenix | AZ | 41.4 | 35.6 | 55.9 | 1,445,632 |
| San Antonio | TX | 36.9 | 30.9 | 44.5 | 1,327,407 |
| San Diego | CA | 53.3 | 37.3 | 43.0 | 1,307,402 |
| Dallas | TX | 46.0 | 38.9 | 49.3 | 1,197,816 |
| San Jose | CA | 50.5 | 40.1 | 61.5 | 945,942 |
| Jacksonville | FL | 25.6 | 20.8 | 40.5 | 821,784 |
| Indianapolis | IN | 31.0 | 24.9 | 42.8 | 820,445 |
| San Francisco | CA | 88.7 | 77.1 | 72.3 | 805,235 |
| Austin | TX | 41.7 | 34.8 | 54.0 | 790,390 |
| Columbus | OH | 41.2 | 30.2 | 47.7 | 787,033 |
| Fort Worth | TX | 34.9 | 21.6 | 38.6 | 741,206 |
| Charlotte | NC | 26.4 | 27.4 | 31.3 | 731,424 |
| Detroit | MI | 51.1 | 35.7 | 52.1 | 713,777 |
| El Paso | TX | 40.4 | 28.0 | 42.0 | 649,121 |
| Memphis | TN | 35.0 | 22.2 | 41.2 | 646,889 |
| Baltimore | MD | 64.3 | 53.2 | 53.4 | 620,961 |
| Boston | MA | 82.8 | 72.4 | 69.4 | 617,594 |
| Seattle | WA | 74.4 | 59.6 | 71.1 | 608,660 |
| Washington, DC | DC | 76.7 | 68.7 | 69.5 | 601,723 |
| Nashville | TN | 28.8 | 21.7 | 29.7 | 601,222 |
| Denver | CO | 61.2 | 44.6 | 71.8 | 600,158 |
| Louisville | KY | 34.3 | 27.3 | 43.3 | 597,337 |
| Milwaukee | WI | 61.5 | 48.7 | 57.6 | 594,833 |
| Portland | OR | 67.3 | 49.3 | 82.7 | 583,776 |
| Las Vegas | NV | 42.0 | 35.5 | 46.5 | 583,756 |
| Oklahoma City | OK | 34.1 | 16.9 | 40.2 | 579,999 |
| Albuquerque | NM | 42.6 | 28.6 | 60.9 | 545,852 |
| Tucson | AZ | 43.2 | 34.5 | 66.3 | 520,116 |
| Fresno | CA | 46.6 | 33.1 | 58.1 | 494,665 |
| Sacramento | CA | 49.0 | 33.9 | 66.9 | 466,488 |
| Long Beach | CA | 73.3 | 48.9 | 70.1 | 462,257 |
| Kansas City | MO | 35.3 | 25.5 | 35.0 | 459,787 |
| Mesa | AZ | 37.9 | 27.0 | 59.6 | 439,041 |
| Virginia Beach | VA | 33.1 | 20.7 | 41.7 | 437,994 |
| Atlanta | GA | 47.7 | 43.7 | 41.7 | 420,003 |
| Colorado Springs | CO | 36.1 | 18.8 | 44.7 | 416,427 |
| Omaha | NE | 48.2 | 24.0 | 41.7 | 408,958 |
| Raleigh | NC | 31.3 | 29.4 | 39.3 | 403,892 |
| Miami | FL | 76.6 | 57.0 | 64.0 | 399,457 |
| Cleveland | OH | 57.1 | 43.9 | 52.3 | 396,815 |
| Tulsa | OK | 39.0 | 22.7 | 47.2 | 391,906 |
| Oakland | CA | 75.3 | 56.6 | 65.5 | 390,724 |
| Minneapolis | MN | 71.4 | 55.0 | 83.5 | 382,578 |
| Wichita | KS | 34.8 | 19.7 | 43.9 | 382,368 |
| Arlington | TX | 38.1 | 0.3 | 39.5 | 365,438 |
| Bakersfield | CA | 37.3 | 24.6 | 43.7 | 347,483 |
| New Orleans | LA | 58.0 | 43.9 | 65.7 | 343,829 |
| Honolulu | HI | 65.7 | 56.3 | 51.0 | 337,256 |
| Anaheim | CA | 55.7 | 33.9 | 52.3 | 336,265 |
| Tampa | FL | 49.5 | 31.3 | 55.2 | 335,709 |
| Aurora | CO | 42.5 | 35.2 | 53.3 | 325,078 |
| Santa Ana | CA | 67.1 | 43.3 | 62.2 | 324,528 |
| St. Louis | MO | 65.7 | 42.6 | 57.7 | 319,294 |
| Pittsburgh | PA | 62.4 | 55.2 | 54.9 | 305,704 |
| Corpus Christi | TX | 40.3 | 26.6 | 42.1 | 305,215 |
| Riverside | CA | 42.7 | 29.9 | 48.9 | 303,871 |
| Cincinnati | OH | 49.1 | 44.1 | 35.6 | 296,943 |
| Lexington-Fayette | KY | 34.3 | 26.6 | 45.7 | 295,803 |
| Anchorage | AK | 30.9 | 21.6 | 51.8 | 291,826 |
| Stockton | CA | 43.7 | 25.4 | 52.4 | 291,707 |
| Toledo | OH | 46.4 | -- | 45.6 | 287,208 |
| St. Paul Park | MN | 60.4 | 46.4 | 64.0 | 285,068 |
| Newark | NJ | 75.9 | 65.0 | 51.1 | 277,140 |
| Greensboro | NC | 29.4 | -- | 32.2 | 269,666 |
| Buffalo | NY | 66.6 | 47.5 | 62.8 | 261,310 |
| Plano | TX | 40.5 | 14.8 | 52.0 | 259,841 |
| Lincoln | NE | 44.1 | 24.3 | 58.5 | 258,379 |
| Henderson | NV | 30.0 | 24.6 | 43.5 | 257,729 |
| Fort Wayne | IN | 31.7 | 21.7 | 41.0 | 253,691 |
| Jersey City | NJ | 86.6 | 70.5 | 63.9 | 247,597 |
| St. Petersburg | FL | 43.0 | 33.5 | 58.5 | 244,769 |
| Chula Vista | CA | 45.6 | 35.4 | 41.2 | 243,916 |
| Norfolk | VA | 45.8 | 35.7 | 46.9 | 242,803 |
| Orlando | FL | 41.1 | 32.7 | 56.8 | 238,300 |
| Chandler | AZ | 35.4 | 24.4 | 55.4 | 236,123 |
| Laredo | TX | 36.8 | -- | 39.6 | 236,091 |
| Madison | WI | 49.7 | 34.9 | 65.5 | 233,209 |
| Winston-Salem | NC | 22.5 | -- | 29.2 | 229,617 |
| Lubbock | TX | 39.0 | 20.6 | 42.5 | 229,573 |
| Baton Rouge | LA | 39.1 | -- | 44.3 | 229,493 |
| Durham | NC | 30.3 | 27.5 | 37.6 | 228,330 |
| Garland | TX | 40.2 | 29.2 | 40.6 | 226,876 |
| Glendale | AZ | 40.2 | 33.5 | 56.5 | 226,721 |
| Reno | NV | 40.2 | 24.2 | 52.0 | 225,221 |
| Surrey | CA-BC | 46.1 | 47.1 | 55.9 | 468,251 |
| Burnaby | CA-BC | 60.1 | 66.8 | 59.5 | 223,218 |
| Vancouver | CA-BC | 79.8 | 74.4 | 78.9 | 603,502 |
| Winnipeg | CA-MB | 48.5 | 51.2 | 61.1 | 663,617 |
| Calgary | CA-AB | 39.1 | 49.5 | 50.1 | 1,096,833 |
| Saskatoon | CA-SK | 45.7 | 45.0 | 31.7 | 222,189 |
| Edmonton | CA-AB | 40.2 | 48.6 | 39.5 | 812,201 |
| Windsor | CA-ON | 42.4 | 37.9 | 52.3 | 210,891 |
| Kitchener | CA-ON | 44.6 | 46.8 | 54.9 | 219,153 |
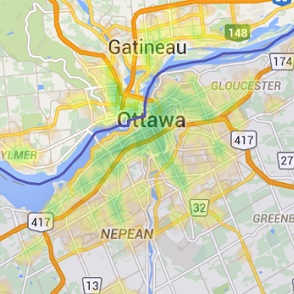
| Ottawa | CA-ON | 45.1 | 49.5 | 63.6 | 883,391 |
| Vaughan | CA-ON | 34.8 | 42.8 | 44.3 | 288,301 |
| Hamilton | CA-ON | 49.6 | 45.4 | 50.3 | 519,949 |
| Mississauga | CA-ON | 48.9 | 56.0 | 54.1 | 713,443 |
| Brampton | CA-ON | 42.5 | 53.3 | 54.8 | 523,911 |
| Gatineau | CA-QC | 37.4 | 40.8 | 57.6 | 265,349 |
| Toronto | CA-ON | 61.0 | 78.2 | 61.0 | 2,615,060 |
| London | CA-ON | 38.6 | 45.0 | 52.8 | 366,151 |
| Longueuil | CA-QC | 54.4 | 52.5 | 69.6 | 231,409 |
| Québec | CA-QC | 44.6 | 46.9 | 59.3 | 516,622 |
| Montréal | CA-QC | 65.4 | 67.0 | 72.6 | 1,649,519 |
| Hialeah | FL | 67.9 | 39.0 | 50.6 | 224,669 |
| Paradise | NV | 50.1 | 38.1 | 50.1 | 223,167 |
| Chesapeake | VA | 21.3 | 13.9 | 34.7 | 222,209 |
| Scottsdale | AZ | 31.9 | 23.3 | 56.4 | 217,385 |
| North Las Vegas | NV | 33.7 | 33.3 | 48.5 | 216,961 |
| Irving | TX | 44.8 | 28.7 | 42.0 | 216,290 |
| Fremont | CA | 49.9 | 36.3 | 54.4 | 214,089 |
| Irvine | CA | 43.2 | 25.7 | 69.5 | 212,375 |
| Birmingham | AL | 33.2 | 21.5 | 30.7 | 212,237 |
| Rochester | NY | 60.7 | 41.3 | 59.9 | 210,565 |
| San Bernardino | CA | 45.0 | 30.9 | 43.6 | 209,924 |
| Spokane | WA | 49.2 | 36.0 | 52.1 | 208,916 |
| Gilbert | AZ | 29.0 | 15.1 | 52.6 | 208,453 |
| Arlington | VA | 71.2 | 58.6 | 72.3 | 207,627 |
| Montgomery | AL | 25.8 | 16.4 | 32.9 | 205,764 |
| Boise | ID | 38.5 | 22.6 | 62.3 | 205,671 |
| Richmond | VA | 50.9 | -- | 50.8 | 204,214 |
| Des Moines | IA | 45.0 | 30.1 | 39.4 | 203,433 |
| Fayetteville | NC | 21.4 | -- | 29.7 | 200,564 |
| Laval | CA-QC | 43.1 | 46.3 | 57.3 | 401,553 |
| Markham | CA-ON | 34.5 | 49.3 | 46.8 | 301,709 |
| Chicago | IL | 77.2 | 65.0 | 72.2 | 2,695,598 |
If you are using a screen reader or having trouble reading this website, please call Walk Score customer service at (253) 256-1634.
© 2026 Walk Score


